![m19-transparent.png]](https://help.m19.com/hs-fs/hubfs/m19-transparent.png?height=50&name=m19-transparent.png)
Product-level hourly performance report
Our conversion reporting is based on the PDT time zone
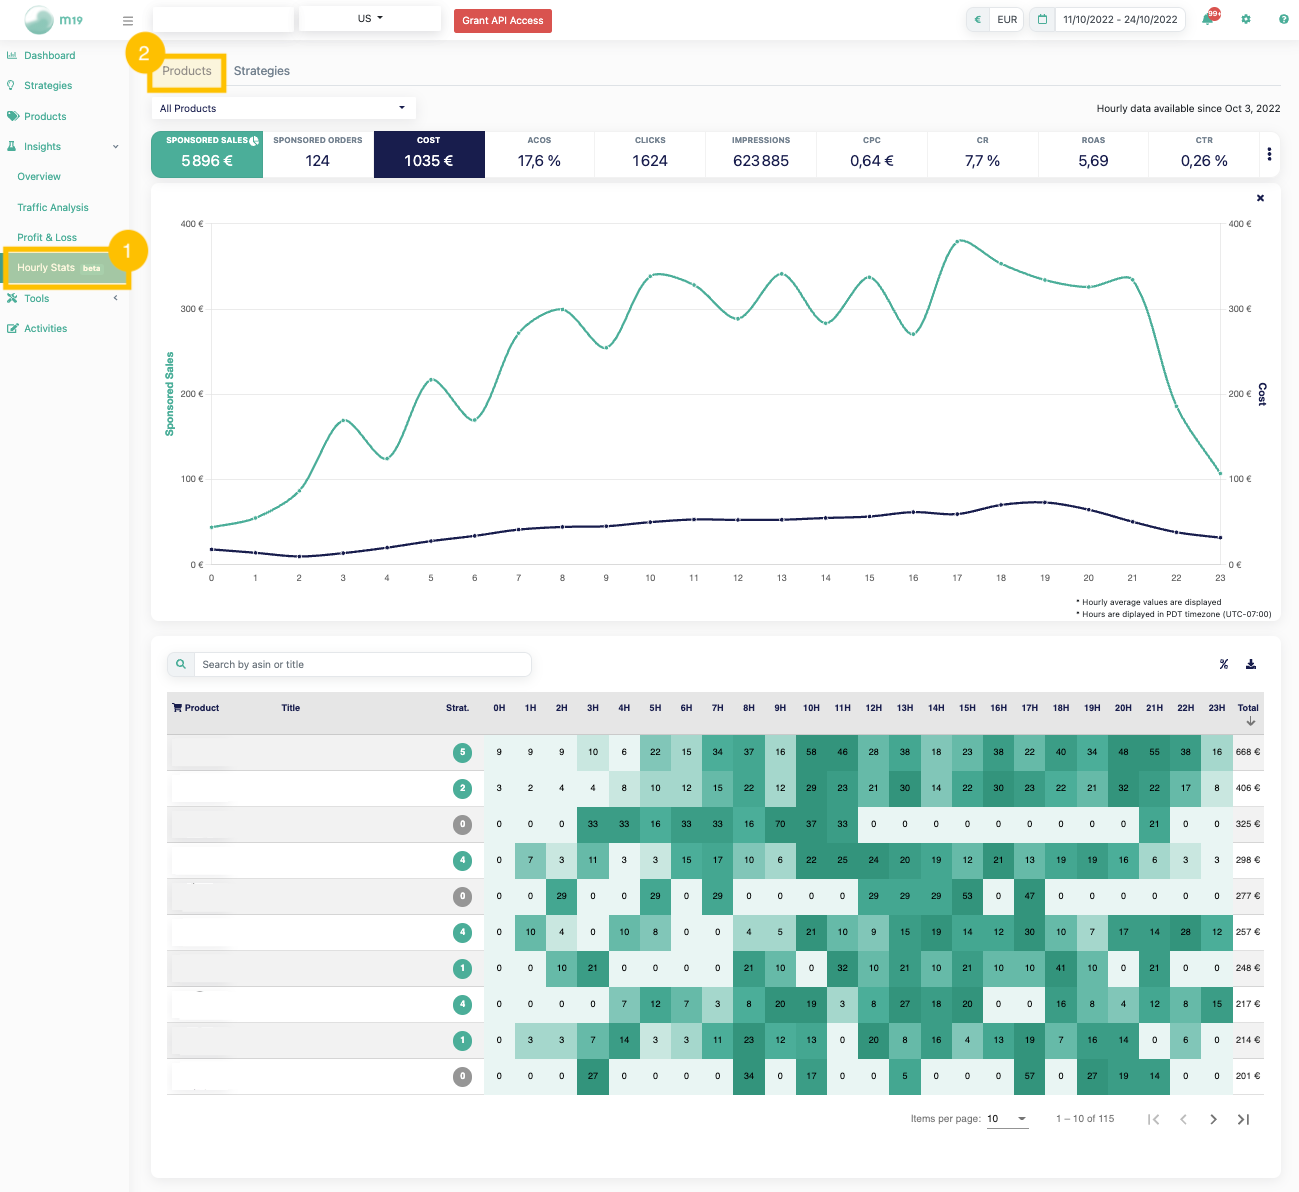
Graphs
The curves displayed by clicking on the metrics are averages of the selected date range according to the time and group of selected ASINs.
In this example, the curves displayed are the average cost and average advertising sales per hour for all ASINs in the catalog between October 11, 2022 to October 24, 2022.
Tables
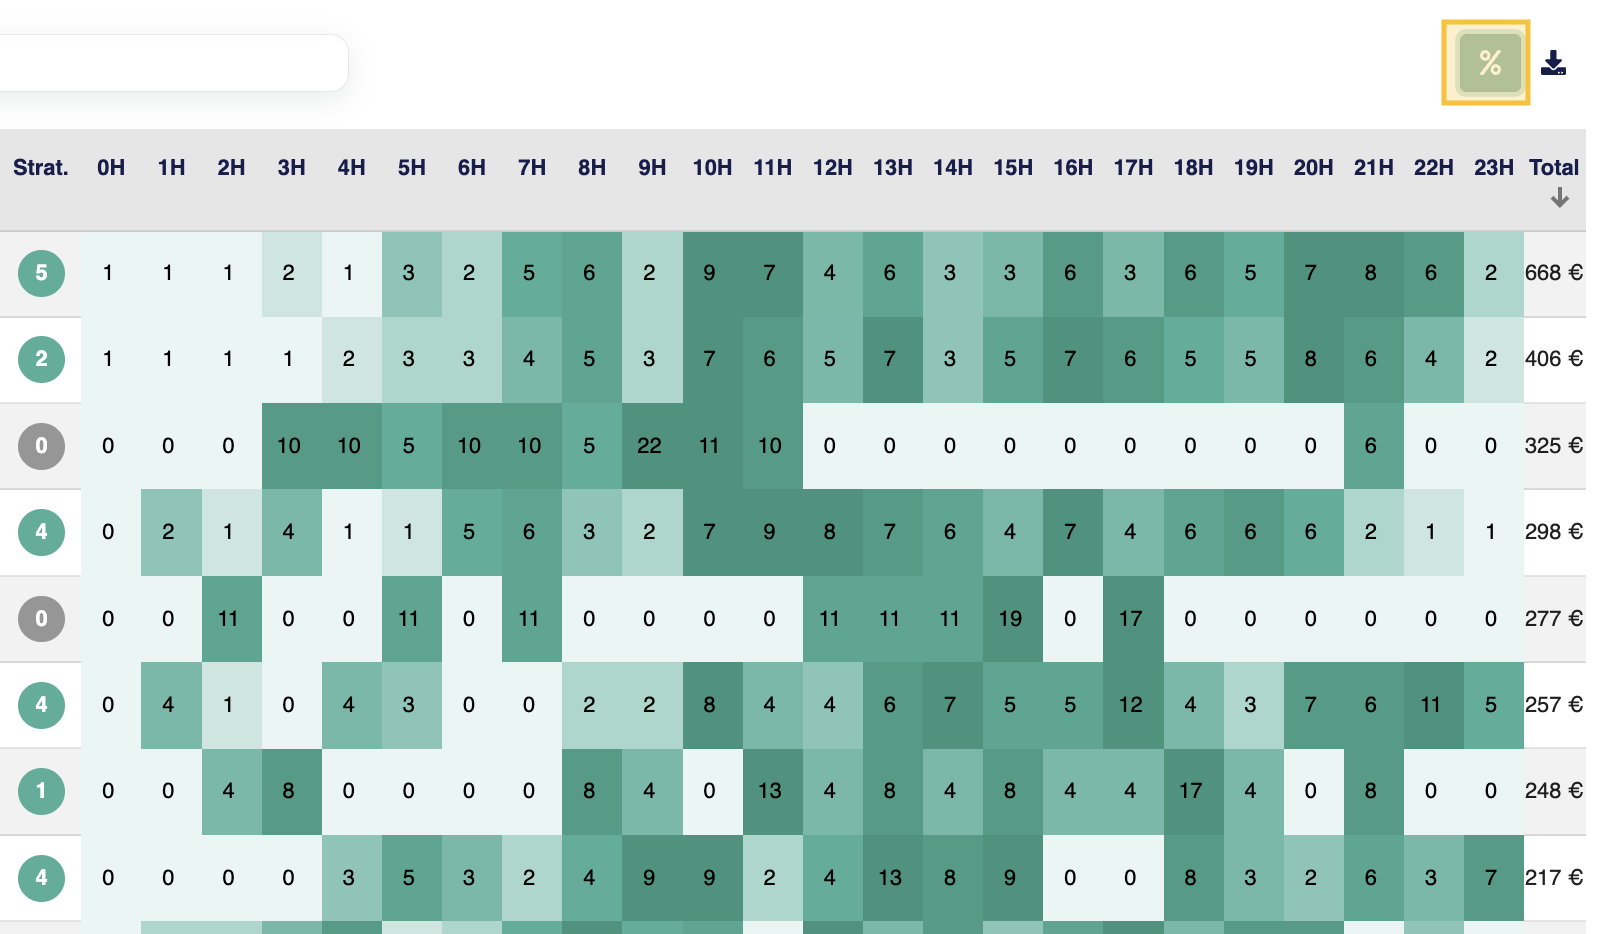
The value displayed in our table is the average value per hour for each asin based on the selected date range.
The darker the color, the higher the value.
Absolute value can be changed into a relative value by clicking on the "%" icon in the top right of the table
Strategy-level hourly performance report
The different reports presented above can be also displayed at the strategy level
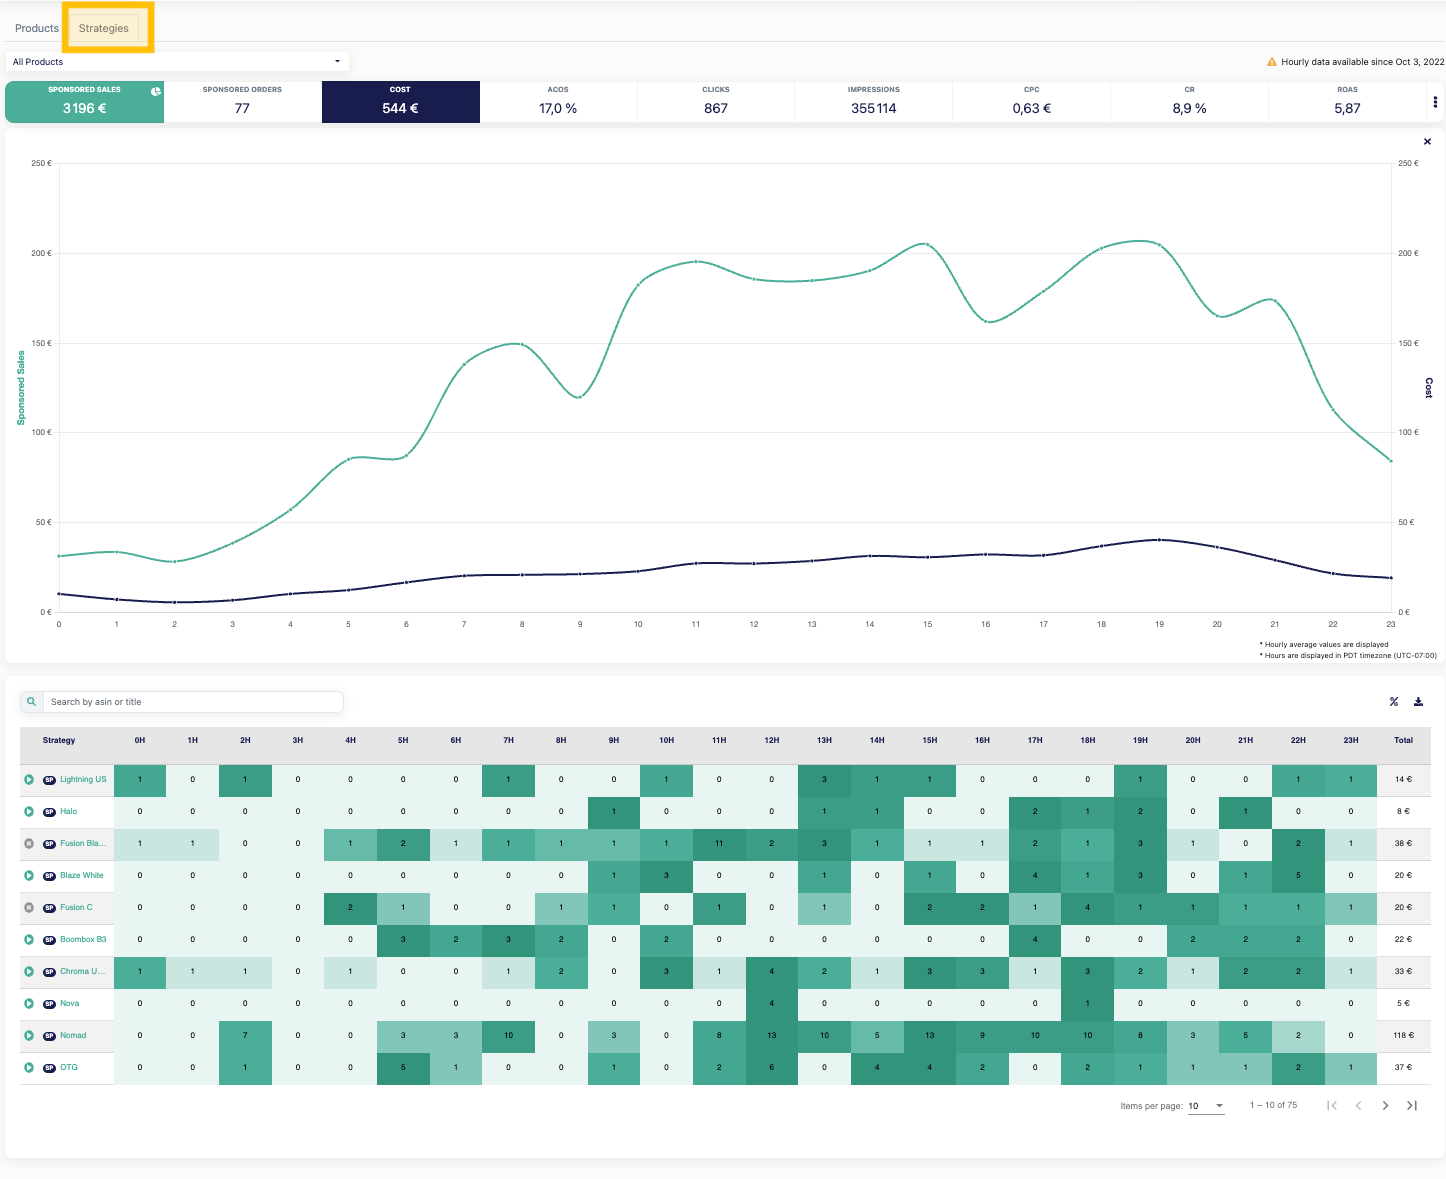
This report is available for all marketplaces except India.