![m19-transparent.png]](https://help.m19.com/hs-fs/hubfs/m19-transparent.png?height=50&name=m19-transparent.png)
Key features
- Compare strategies' metrics through tables and graph
- Check algorithm mode and errors
- Download data
Compare strategies' metrics
The main feature is to compare strategies metrics by type or strategy by strategy. Let's take a closer look at the screen below.
Graphs
At the top of the screen, you can select the metrics to get a graph by campaign type and strategies. Here we selected cost as the main metrics and see that product strategies represent 82,2 % of the overall cost of your strategies
Tables
At the bottom of the screen, you can compare each strategies' metrics, show a graph per strategy with the graph icon on the right and look at each tactic within a strategy with the table icon on the right.
When you click on the table icon on the right of a strategy, it displays how the traffic is segmented, that is :
- All other traffic: the campaigns created on the strategy level
- The tactics' name: the campaigns created for each tactic.
Here are the campaigns the algorithm creates for each source of traffic.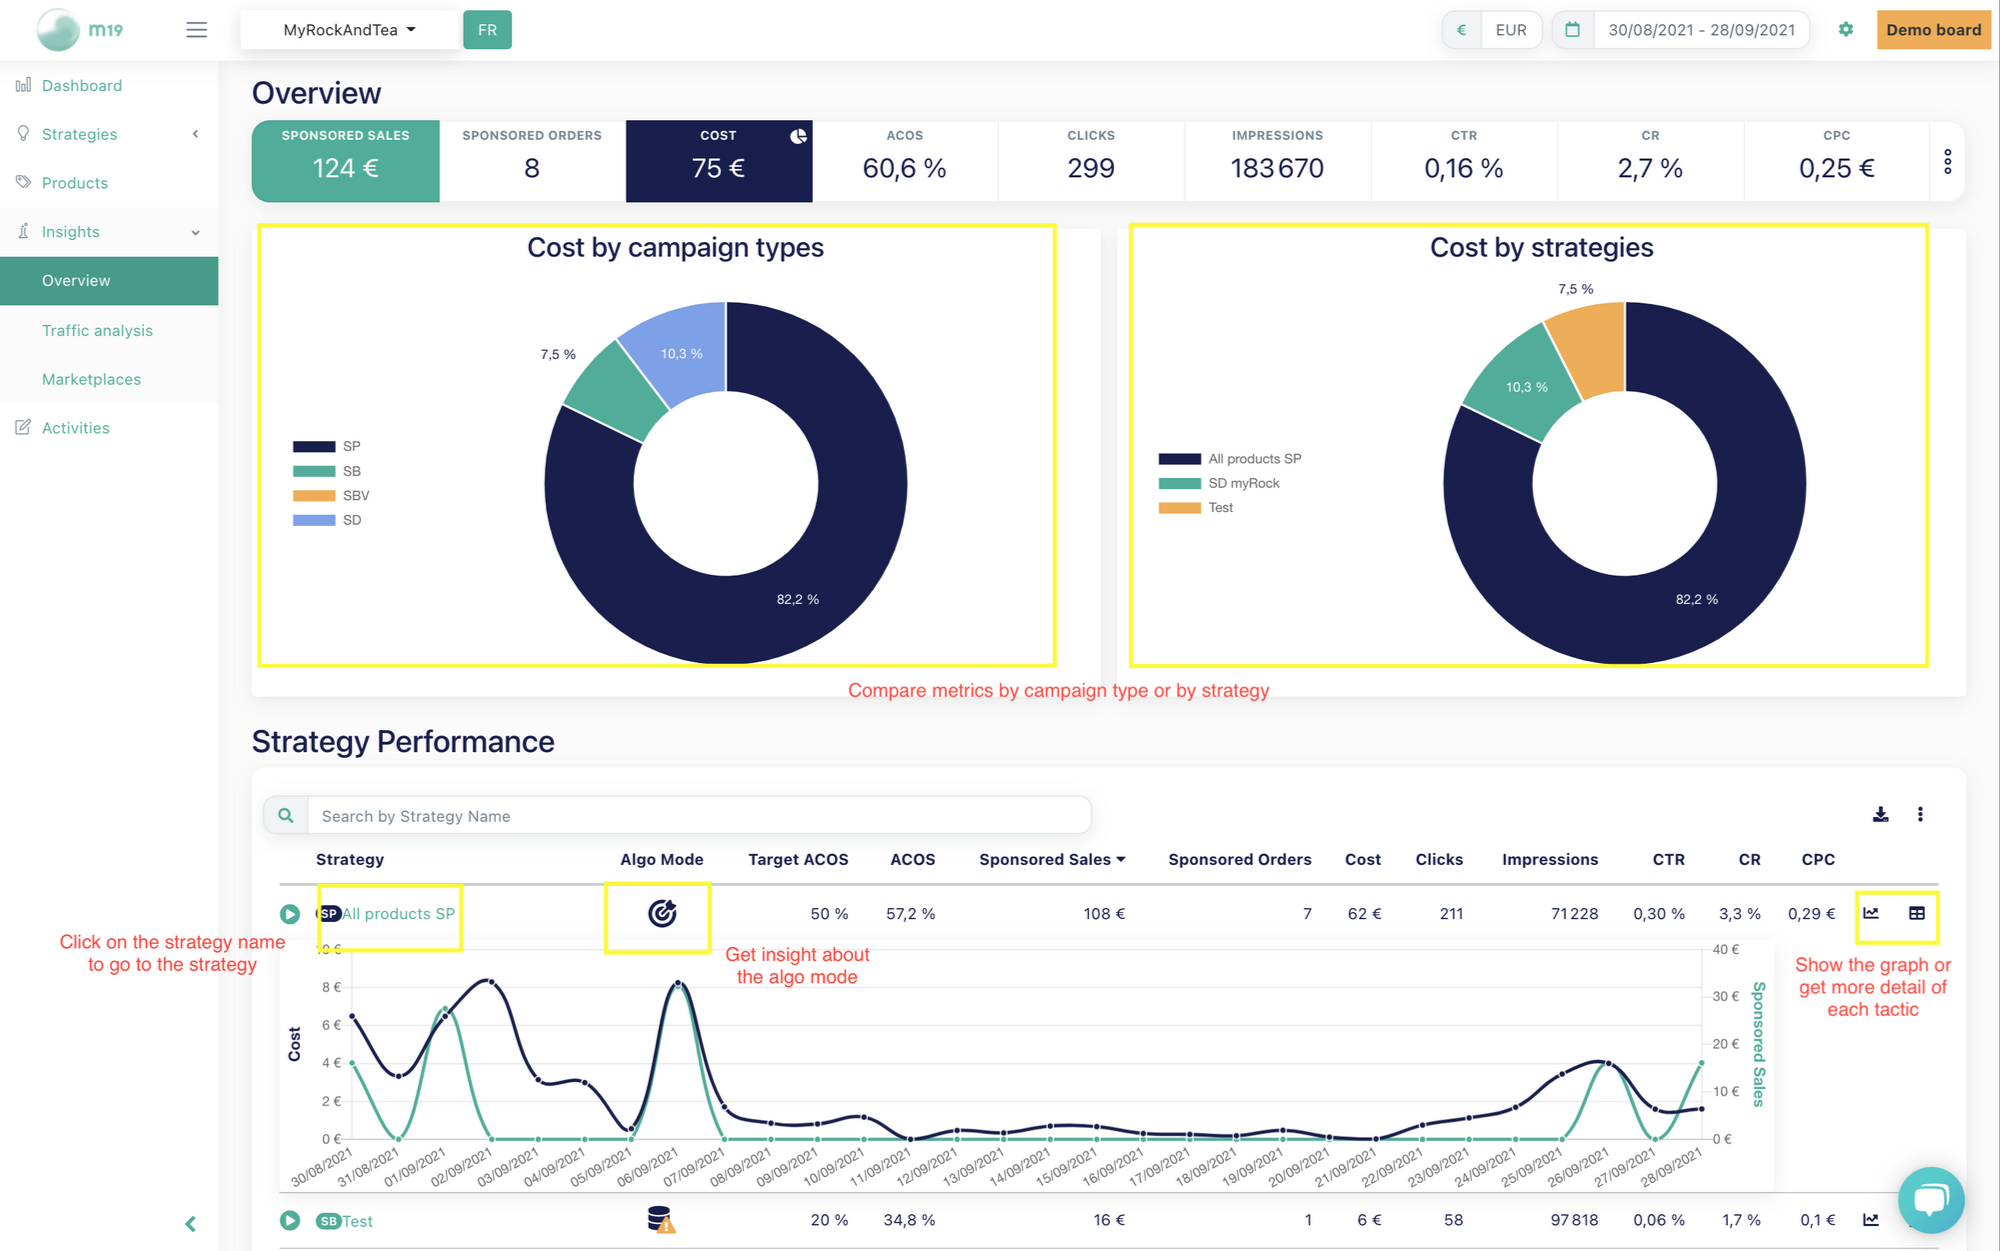
Check algorithm mode and errors
Each strategy can have an algorithm mode represented with an icon. An algorithm mode is an insight into how the algorithm is doing.
For instance, an icon with a danger sign means that the strategy might have a problem.
You can dive into the icons below :
What does the icon inside your strategy card mean
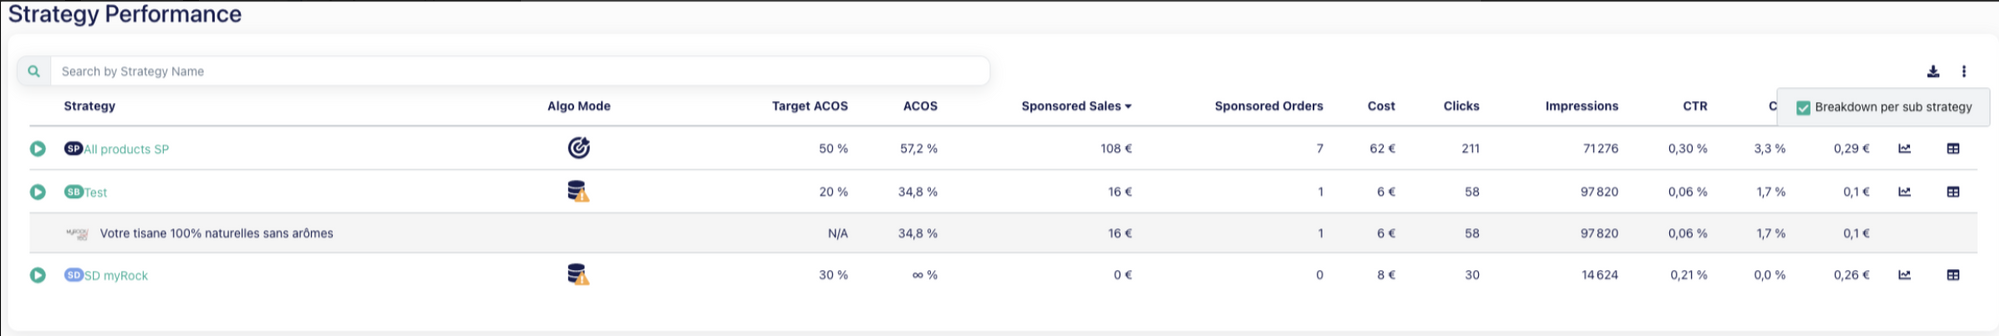
Download data
You can download all strategies performances from the table at the bottom of the page. Before downloading, you can choose to break down per sub-strategy to analyse more granular data. Data is exported as a CSV file.