
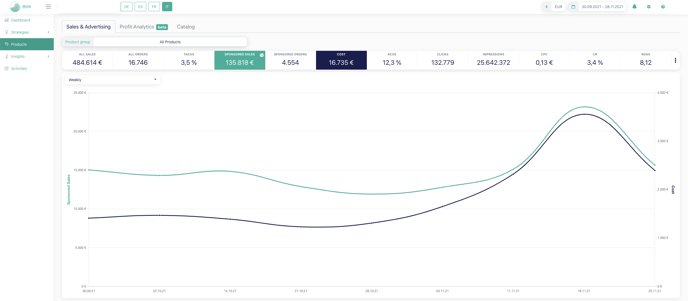
Product sales and advertising analysis tells you how your products perform through organic and sponsored sales !
The algorithm imports data from Amazon's report in order to display them in the Sales and advertising section.
Key Features:
- Compare Products: See how your products stack up against each other within a product group
- Dual Metrics: Analyze up to two metrics simultaneously.
- Date Aggregation: View data by days, weeks, or months.
- Period Comparison: Compare current data to previous periods
- ASIN or Title Filter: Easily find products by their ASINs or titles.
- Detailed Metrics: Dive deep into the performance of your products.
- Strategy Insights: Review and refine your product's strategies
How to check the ACOS of your products?
Checking your ACOS is essential for creating effective strategies on ACOS Target optimisation. Here's how you can do it:
- Go to the Sales and Advertising section.
- Select the product group or strategy you want to check from the drop-down menu on the upper left side.
- Choose the last 30 days in the date picker.
- Click on "ACOS" on the board to see the daily values on the chart.
This information helps you set realistic ACOS targets for your strategies.
Additional Features
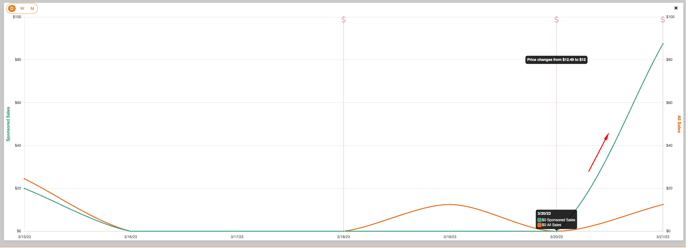
- Product Timeline Events: Track changes to an ASIN, such as parent ASIN changes, title, brand, image, reviews, review score, price, category, and BSR changes.
Example 1.
Example 2.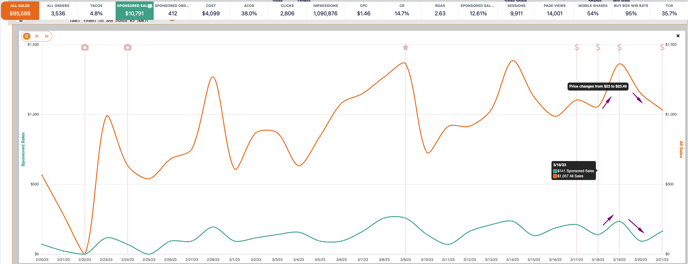
-
Custom Fields: Add notes next to ASINs with our customizable fields. This feature helps you organize and highlight important product information. For more detailed information, please refer to this article on custom fields.
-
Profit Analytics: Profit analytics provides insights into how your products perform financially. We use data from Amazon's Settlement Reports to display this information.
Our Recommendations
- No Product Group: Compare and group products based on similar performance metrics.
- Existing Product Groups: Regularly compare products within a group to ensure they belong together.
- Cost of Goods: Ensure each product in your catalog has a cost of goods entered.
By using these tools and tips, you can make informed decisions to optimize your product strategies and profitability